“Unable to Process Request. Concurrent requests limit exceeded.
To protect all customers from excessive usage and Denial of Service attacks, we limit the number of long-running requests that are processed at the same time by an organization. Your request has been denied because this limit has been exceeded by your organization. Please try your request again later.”
Salesforce Developer Blog Says:
The multitenant Force.com platform uses governor limits to ensure that system resources are available to all customers and to prevent any one customer from monopolizing them. If a governor limit is exceeded, the associated execution governor limit issues a runtime exception that cannot be handled. When you design your applications, you can help plan for their growth by keeping these limits in mind.
One of the limits customers frequently reach is the concurrent request limit. Once a synchronous Apex request runs longer than 5 seconds, it begins counting against this limit. Each organization is allowed 10 concurrent long-running requests. If the limit is reached, any new synchronous Apex request results in a runtime exception. This behavior occurs until the organization’s requests are below the limit.
Ultimately, this limit is in place to protect the user experience. Would you want your users waiting 5 seconds or more for a page to load?
So how would you know which operation is taking time? Even you can track it through Debug logs using many filter Extensions like ‘Salesforce Debug Logs Analyzer’. One more level is Salesforce Event Log, obviously you should have access of it.
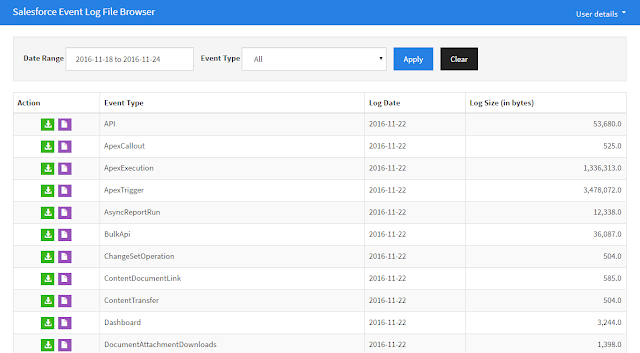
Go to https://salesforce-elf.herokuapp.com/
Login with your Salesforce Sandbox or Production login. Select dates range and apply, now you can download Salesforce Event Log File by Event Type.
Open in excel and Sort by Execution Time and see where its taking time, optimize that using best practice or adjusting business rules.
If the cause was a high callout time, you can filter your ApexExecution file based on QUIDDITY (E, H, M, R, V, W, X, L, K, or I) and CALLOUT_TIME (>5000), both of which were added in the Spring ’16 release.
The values for quiddity in the logs include:
A – Legacy Batch Apex
C – Schedule Apex
E – Inbound Email Service
F – Future
H – Apex REST
I – Invocable Action
K – Quick Action
L – Aura
M – Remote Action
Q – Queuable
R – Synchronous
S – Serial Batch Apex
T – Apex Tests
TS – Synchronous Apex Tests
TA – Asynchronous Apex Tests
V – Visualforce
W – SOAP Webservices
X – Execute Anonymous